
How to Turn a Word Document into a Presentation with AI
If you have a report, proposal, or memo in Word and need slides for a meeting, this guide shows how to turn that .docx into an editable presentation with AI. You attach the document, check the outline against its headings and tables, and leave with a 10-slide deck you can present or export.
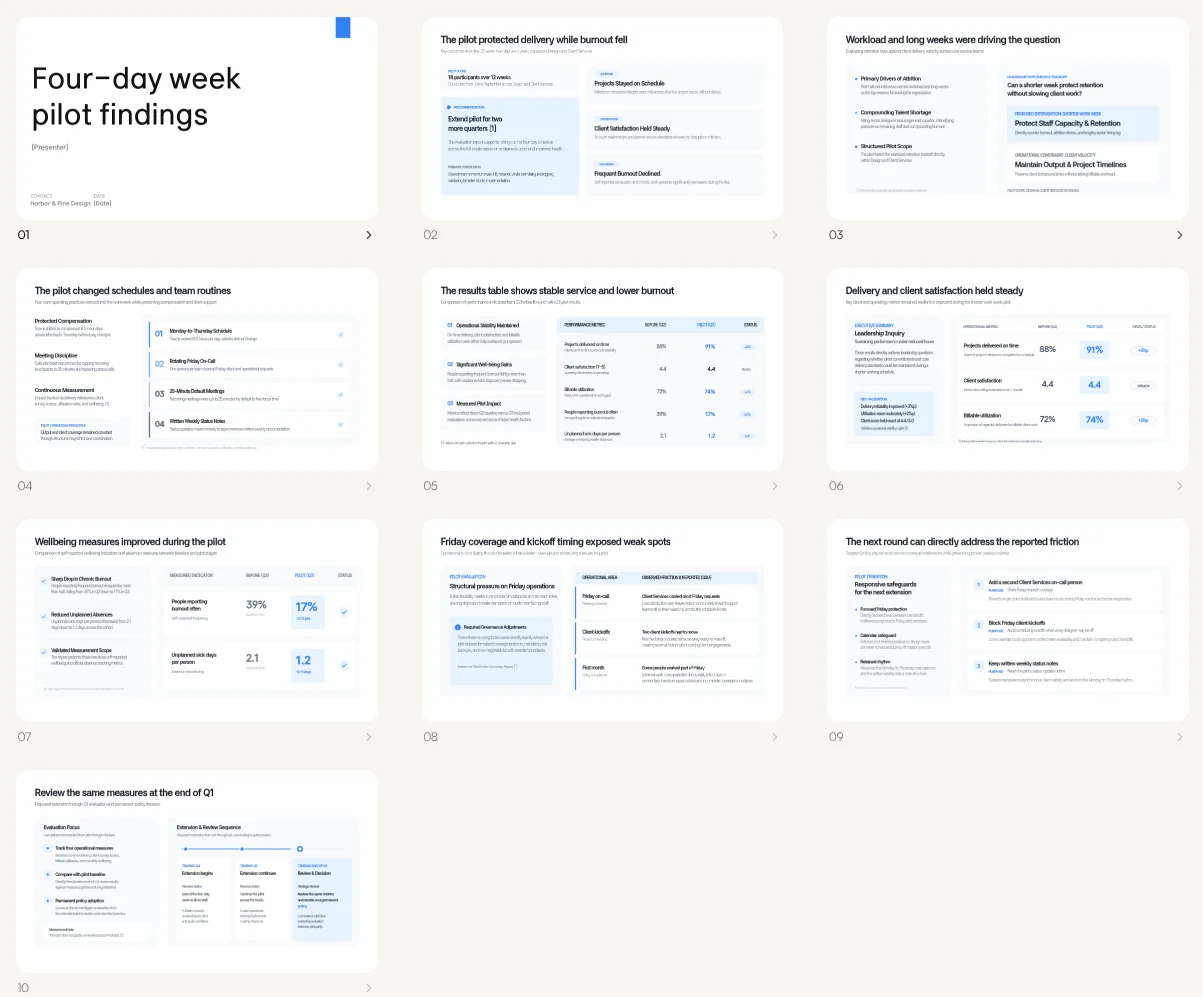
Example deck made for this post: Four-day week pilot findings. The source is a sample report from a fictional company, Harbor & Pine Design.
When you need it
- The content is already written in Word, and the meeting needs slides.
- The document has a results table that has to land on a slide correctly.
- You want a deck you can edit, not a page-by-page copy of the document.
Step by step: from a .docx to a deck
The source for this example is a two-page Word report with six numbered headings and one results table: summary, why the pilot ran, how it worked, results, what did not work, and the recommendation with next steps.
1. Attach the .docx and write the prompt
On the Snapdeck home screen, click the paperclip at the bottom right of the prompt box and pick your .docx. The file name appears above the prompt. Then say what the deck is for. This is the exact prompt used for the example:
Turn this report into a 10-slide deck for a leadership meeting. Keep the results table as a chart or table slide, and end with the recommendation and next steps.
Choose PPT 16:9 above the prompt, set the slide count to 10 with the − / + stepper below it, and press Enter. Supported file types and size limits are in the HWP and Word attachment post.

2. Pick a style and a theme
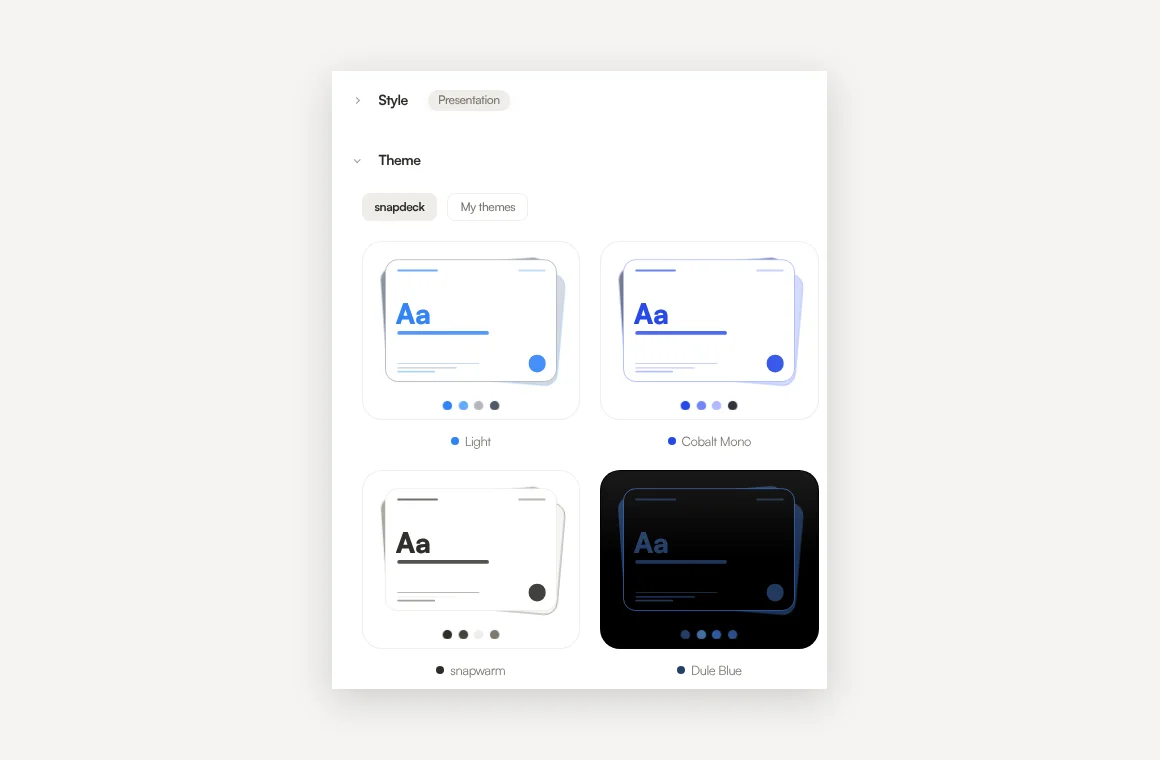
Next, pick a style and a theme. The example uses the Presentation style with the Light theme. For a meeting-room screen or a screen share, a light theme keeps table numbers easy to read.
3. Review the outline before you generate
Before any design is generated, Snapdeck shows a slide-by-slide outline with a title and key points for each slide. You can change the content and the order here, and it is the easiest place to fix structure.
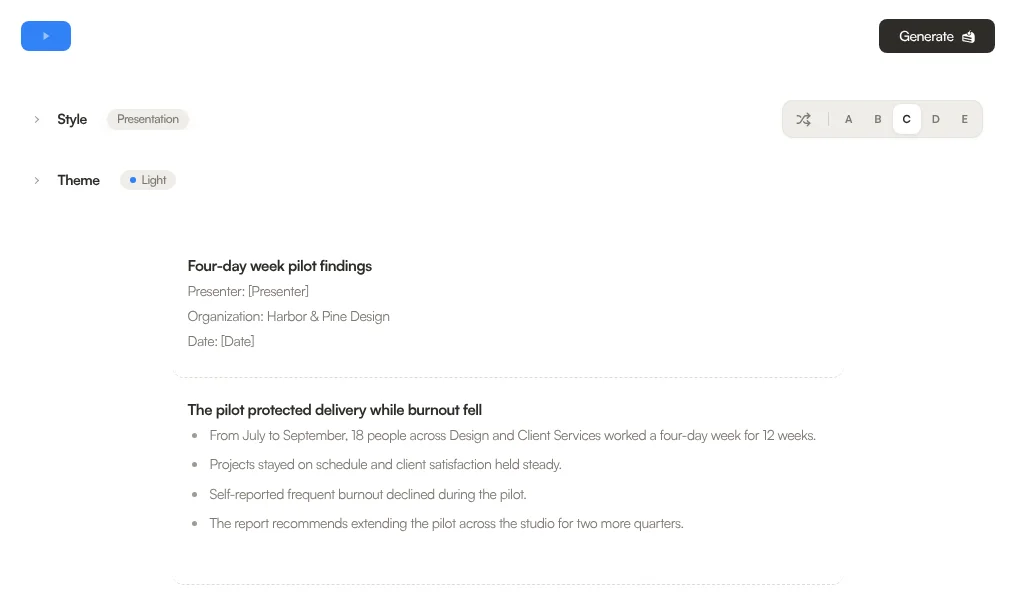
The example outline followed the document well, but two things needed a hand:
- The title slide kept
[Presenter]and[Date]placeholders. The report named neither, so Snapdeck left slots instead of inventing them. Fill them in here or after generating. - The main recommendation, extending the pilot for two more quarters, landed on slide 2 instead of a final slide. The report's summary paragraph already stated it, so it came forward with the summary. Slides 9 and 10 cover the next steps (Friday safeguards and the end-of-Q1 review), but no closing slide states the decision in one line. If that decision is the last thing leadership should see, move or add that slide in the outline.
4. Generate
When the outline matches the story you would tell out loud, click Generate at the top right. Snapdeck designs the slides and opens the editor. The example came out at 10 slides, with the title-slide placeholders from the outline still in place.

5. Edit in the editor and the grid view
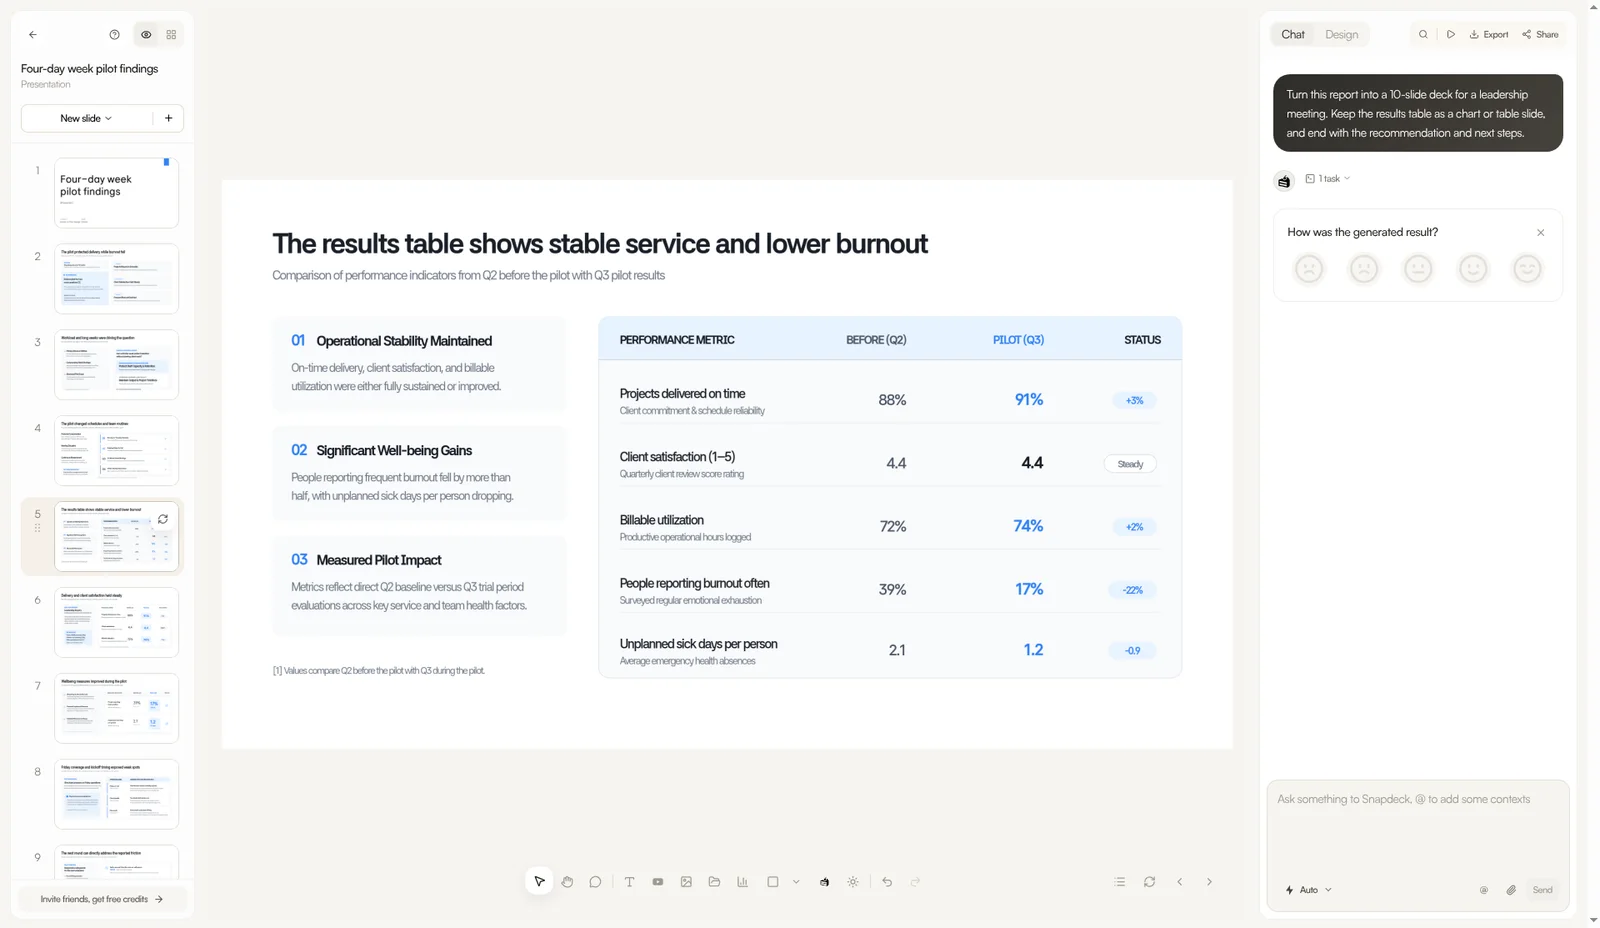
Click any text on a slide to edit it. This is where [Presenter] and [Date] get filled in. For changes you would rather describe, type them in Chat on the right. The grid icon at the top left shows all 10 slides at once, which makes the flow easy to check.
Check the numbers against the source. Slide 5 in the example carried all five rows of the results table with the original values (88%→91%, 4.4→4.4, 72%→74%, 39%→17%, 2.1→1.2). It also added a Status column that was not in the report (+3%, Steady, +2%, −22%, −0.9). Derived values like these need a check too.
6. Export
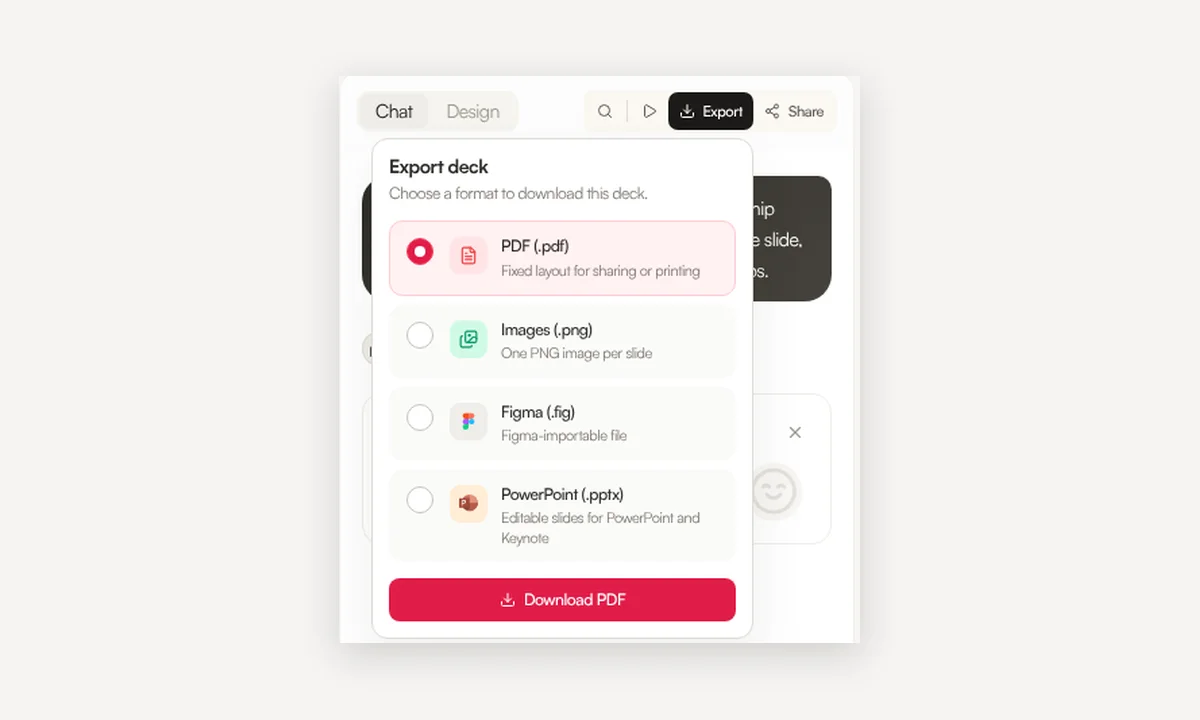
Click Export at the top right to choose PDF (.pdf), Images (.png, one per slide), Figma (.fig), or PowerPoint (.pptx). PDF and PNG export are available on every plan; PowerPoint (.pptx) and Figma (.fig) export are Pro. To show the deck as a link instead of a file, use Share. The example deck above is shared that way.
Check the outline against the source document
Most mistakes in a document-to-deck conversion are about structure and numbers, and both are faster to catch in the outline than across ten designed slides. Open the source document next to the outline and check:
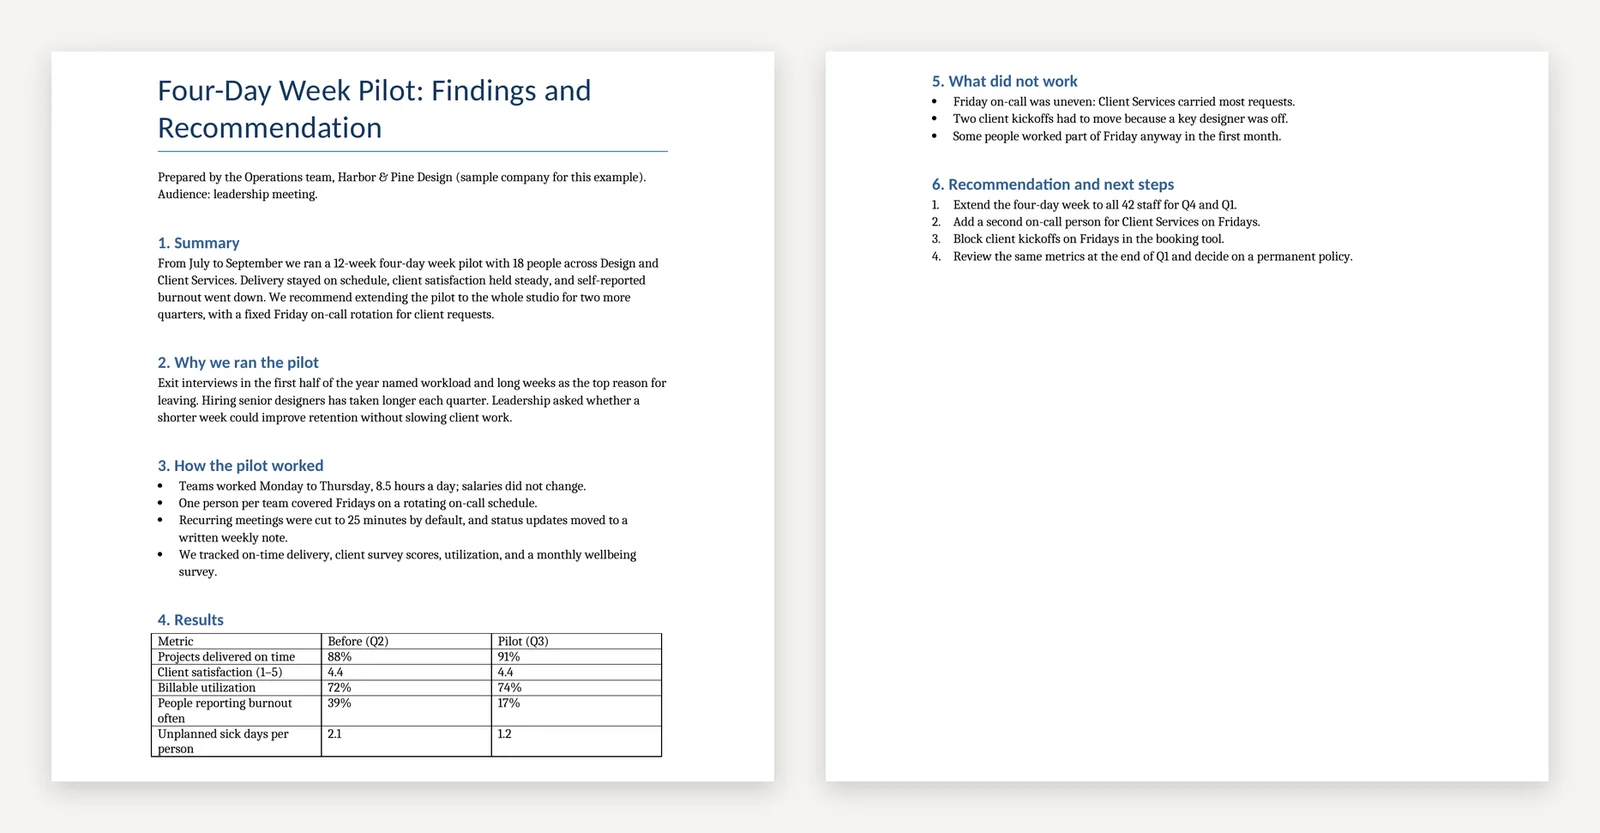
- Every main heading has a slide. Each section of the document (the H2-level headings) should become at least one slide. In the example, six sections became the nine slides after the title.
- Long sections are split. A section that will not fit on one slide should be broken up. The example's Results section became three slides: the full table, delivery and client satisfaction, and wellbeing.
- Table numbers carried over exactly. Match totals, dates, percentages, and before/after columns against the source table row by row. Watch for unit changes, such as percent versus percentage points, and check any value the AI calculated.
- The conclusion sits where you want it. If the recommendation should come last, make sure it does, and that placeholders are filled.
Prep the document before you attach it
- Give every section a clear heading. One topic per heading makes the outline easy to match against the document.
- Keep key numbers in a simple table with a header row, and put units in the header.
- Put the recommendation or ask under its own heading. If it only lives in the summary, it can move forward, as it did in the example.
- Headers, footers, footnotes, and text inside images are not read, so move anything the deck needs into the body.
- If you know the presenter and date, add them to the prompt.
Steps at a glance
- Attach the .docx with the paperclip on the home prompt, and write who the deck is for and what it should do.
- Choose PPT 16:9 and set the slide count with the stepper.
- Pick a style and a theme.
- Check the outline against the source document, and fix structure, numbers, and where the conclusion lands.
- Click Generate, then check placeholders and numbers in the editor and the grid view.
- Export to PDF, PNG, Figma, or PowerPoint, or send a share link.
FAQ
Can I attach a Word file directly?
Yes. Snapdeck accepts Word (.doc, .docx) and Hangul (.hwp, .hwpx) attachments, up to 50MB per file. Password-protected or distribution-protected documents need the protection removed before you attach them.
Which export formats are available?
PDF, a PNG per slide, Figma (.fig), and PowerPoint (.pptx). PDF and PNG export are available on every plan; PPTX and Figma export are Pro.
Will the numbers in my tables carry over?
Snapdeck reads text inside tables along with the body. In the example, all five rows of the results table came through with the original values, but a calculated column was added, so compare against the source table once before you present.